Profitability ratios भनेको financial measurement हुन्, जसले company ले आफ्नो revenue, operating costs, assets, वा equity को आधारमा कत्तिको earnings (profit) generate गरिराछ भनेर measure गर्छ। यी ratios investors र analysts ले company को financial health र operational efficiency बुझ्न use गर्छन्। Profitability ratios लाई best रुपमा तुलना गर्न भनेको company को competitors (industry peers) वा आफ्नै past performance सँग तुलना गर्छ।
Profitability ratios company को financial performance र health को window (झ्याल) जस्तै हुन्छन्। यी ratios लाई comparison tool को रुपमा use गर्न best हुन्छ, न कि केवल measurement को रुपमा, किनकि यसले एकदमै clear picture दिन्छ। Profitability ratios लाई efficiency ratios सँग पनि use गर्न सकिन्छ, जुन ratios ले company ले आफ्नो assets लाई कत्तिको efficiently income generate गर्न use गरेको छ भनेर measure गर्छ, खासगरी costs काटेपछि (after-cost profits).
Main Points
- Profitability ratios ले company को sales वा operations, balance sheet assets, वा shareholders’ equity बाट profit कमाउने capacity measure गर्छ।
- यी ratios ले company ले कत्तिको efficiently profit generate गर्छ र shareholders का लागि value बनाउँछ भनेर देखाउँछ।
- Profitability ratios मा margin ratios र return ratios include हुन्छन्।
- Higher profitability ratios generally राम्रो मानिन्छ, किनकि यसले revenue लाई profit मा बदल्न सफलता देखाउँछ।
- यी ratios company को present performance, अघिल्लो performance, industry average, वा competitors सँग तुलना गर्न use गरिन्छ।
Profitability Ratios ले के बताउँछन्?
Profitability ratios ले company को management कत्तिको राम्रोसँग business operate गरिराछ भन्ने देखाउन मद्दत गर्छ। Investors ले profitability ratios लाई अन्य research सँग combine गरेर company मा invest गर्न उपयुक्त छ कि छैन भनेर निर्णय गर्छन्।
सामान्यतया, higher profitability ratios ले company को strengths र advantages देखाउँछ, जस्तै company ले आफ्नो products का लागि धेरै (या कम) charge गर्न सक्ने capacity, र कम cost मा काम गर्न सक्ने efficiency।
Company का profitability ratios तब सबैभन्दा उपयोगी हुन्छन् जब similar companies, company कै अघिल्लो performance, वा industry average सँग तुलना गरिन्छ। यदि present value अघिल्लो value भन्दा बढी छ भने, company राम्रो गरिरहेको संकेत हुन्छ।
Types of Profitability Ratios:
Profitability ratios generally दुई प्रकारमा divided हुन्छन्—margin ratios र return ratios।
- Margin Ratios: Margin ratios ले company ले sales लाई कत्तिको profit मा बदल्न सकिरहेको छ भन्ने जानकारी दिन्छ। Margin ratios मा gross margin, operating margin, pretax margin, र net profit margin include हुन्छन्।
- Return Ratios: Return ratios ले company ले shareholders को लागि कत्तिको return generate गरेको छ भनेर measure गर्छ। यसमा return on assets (ROA), return on equity (ROE), र return on invested capital (ROIC) include हुन्छन्।
Margin Ratios:
Gross Margin:
Gross profit margin, जसलाई gross margin पनि भनिन्छ, widely used profitability ratio हो। Gross profit भनेको sales revenue र product बेच्न लागेको लागत (COGS) बीचको difference हो। Gross margin ले gross profit लाई revenue सँग compare गर्छ।
Formula: Gross Profit Margin= (Gross Profit/Revenue) × 100
Healthy Ratio: Industry अनुसार फरक पर्न सक्छ, तर generally 40% or higher
Gross profit margin 40% भन्दा माथि हुनु भनेको company को production expenses घटाएर राम्रो कमाई गरिरहेको छ भन्ने देखाउँछ। यसले company ले आफ्नो goods/services को लागि high cost charge गर्न सक्छ भनेर संकेत दिन्छ। जति margin high हुन्छ, त्यति नै company financially strong मानिन्छ। Declining gross margins ले increased competition को संकेत दिन सक्छ।
Operating Margin:
Operating margin ले COGS र normal operating expenses काटेर बचेको percentage of sales measure गर्छ। Operating margin ले company को operations कत्तिको efficiently manage गरेको छ भनेर देखाउँछ।
Formula: Operating Profit Margin= (Operating Income/Revenue) × 100
Healthy Ratio: 15% or higher
Operating profit margin 15% भन्दा माथि हुनु भनेको company आफ्नो दैनिक operating expenses (जस्तै marketing, salaries) लाई राम्रोसँग manage गरिरहेको छ। यो margin high हुनु भनेको company efficient छ र कम खर्चमा राम्रो revenue generate गरिरहेको छ भन्ने बुझाउँछ।
Higher operating margin भएको company लाई fixed costs र obligations को interest manage गर्न बढी capacity छ भन्ने मानिन्छ, र उसले आफ्नो competitors भन्दा कम charge गर्न सक्ने सम्भावना हुन्छ। यस्तो company slowing economy को असर झेल्न पनि सक्षम हुन्छ।
Pretax Margin:
Pretax margin ले सबै expenses (interest payments र inventory write-offs “त्यस्तो Product जसको कुनै value छैन”) काटेर बचेको profit measure गर्छ, तर taxes लाई include गर्दैन।
Formula: Pretax Margin= (Earning Before Tax(EBT)/Revenue) × 100
High pretax margin भएको company लाई financially healthy मानिन्छ, र उसले आफ्नो products/services को सही मूल्य determine गर्न सक्षम हुन्छ।
Net Profit Margin:
Net profit margin, जसलाई net margin पनि भनिन्छ, ले company ले सबै खर्च र taxes काटेर earnings generate गर्न सक्ने capacity देखाउँछ।
Formula: Net Profit Margin= (Net Income/Revenue) × 100
Healthy Ratio: 10% or higher
Net profit margin 10% भन्दा माथि हुनु भनेको company ले सबै खर्च कटाएर राम्रो कमाई गरिरहेको छ। यो अन्तिम profit ratio हो, जसले company को overall financial health देखाउँछ। जति high net profit margin हुन्छ, company को profitability त्यति नै राम्रो मानिन्छ।
Net profit margin ले company को समग्र financial strong health को संकेत दिन्छ। यसले management ले sales बाट कत्तिको profit generate गरिरहेको छ र सबै costs control मा राखिरहेको छ भन्ने देखाउँछ।
Return Ratios:
Return on Assets (ROA):
ROA ले company ले आफ्नो assets कत्तिको effectively use गरेर sales र profits generate गरिरहेको छ भन्ने measure गर्छ।
Formula: ROA=(Net Income/Total Assets)×100
Healthy Ratio: 5% or higher
ROA 5% भन्दा माथि हुनु भनेको company ले आफ्नो सम्पत्ति (assets) लाई राम्रोसँग उपयोग गरेर profit generate गरिरहेको छ। यो ratio ले company को efficiency measure गर्छ। Company ले आफ्नो resources (जस्तै buildings, machines) कति राम्रोसँग उपयोग गरिरहेको छ भनेर देखाउँछ, जसले investor लाई company efficient छ भन्ने signal दिन्छ।
Return on Equity (ROE):
ROE ले shareholders को equity मा return कमाउने company को capacity measure गर्छ।
Formula: ROE=(Net Income/Shareholders’ Equity)×100
Healthy Ratio: 15% or higher
ROE 15% भन्दा माथि हुनु भनेको company ले shareholders को investment मा राम्रो return generate गरिरहेको छ। यो ratio high हुनु भनेको company ले आफ्नो equity राम्रोसँग utilize गरेर राम्रो कमाई गरिरहेको छ भन्ने बुझाउँछ, जसले investors लाई आकर्षित गर्न सक्छ।
Return on Invested Capital (ROIC):
ROIC ले company ले आफ्नो सबै sources (debt र equity सहित) बाट कत्तिको return generate गरिरहेको छ भनेर measure गर्छ। ROIC ले after-tax operating profit लाई total invested capital सँग compare गर्छ।
Formula: ROIC=(Net Operating Profit After Tax (NOPAT)/Invested Capital)×100
Invested Capital = Debt + Equity (total capital used to generate returns)
Healthy Ratio: 10% or higher
ROIC 10% भन्दा माथि हुनु भनेको company ले debt र equity दुवै use गरेर राम्रो return generate गरिरहेको छ। यदि यो ratio company को weighted average cost of capital (WACC) भन्दा माथि छ भने, यसको मतलब company ले investors को लागि value create गर्दैछ र company premium मा trade गर्न सक्छ।
यसरी high profitability ratios भएका company हरू financially strong, efficient र कम risk भएका मानिन्छन्, जसले गर्दा investors र lenders ले तिनमा लगानी गर्न सक्छन्।
Real Life Example


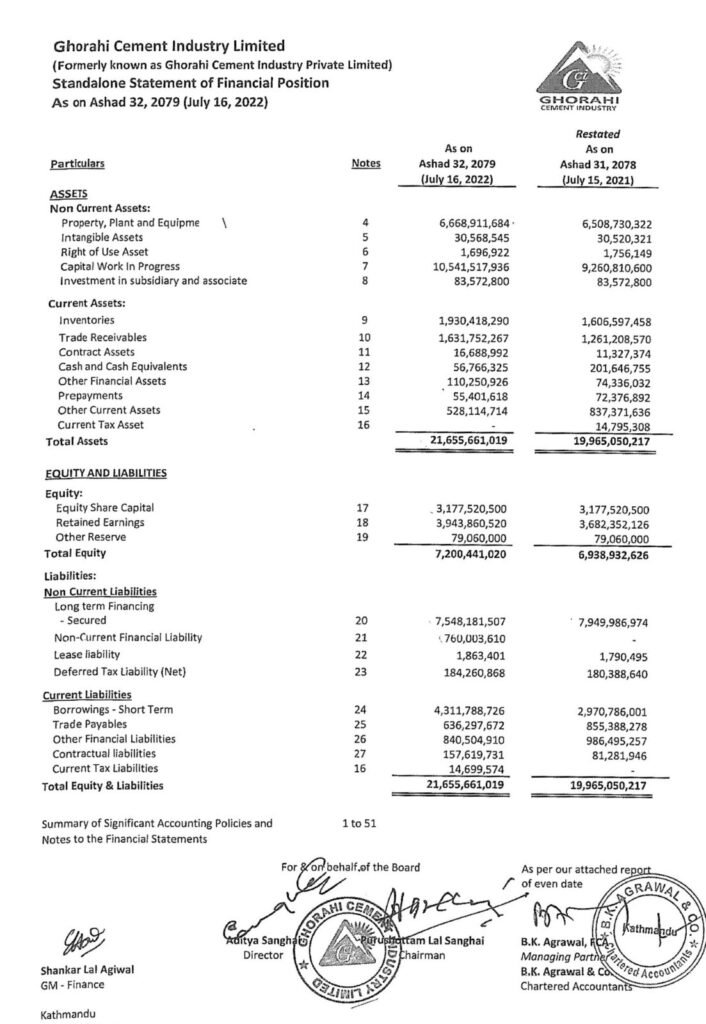
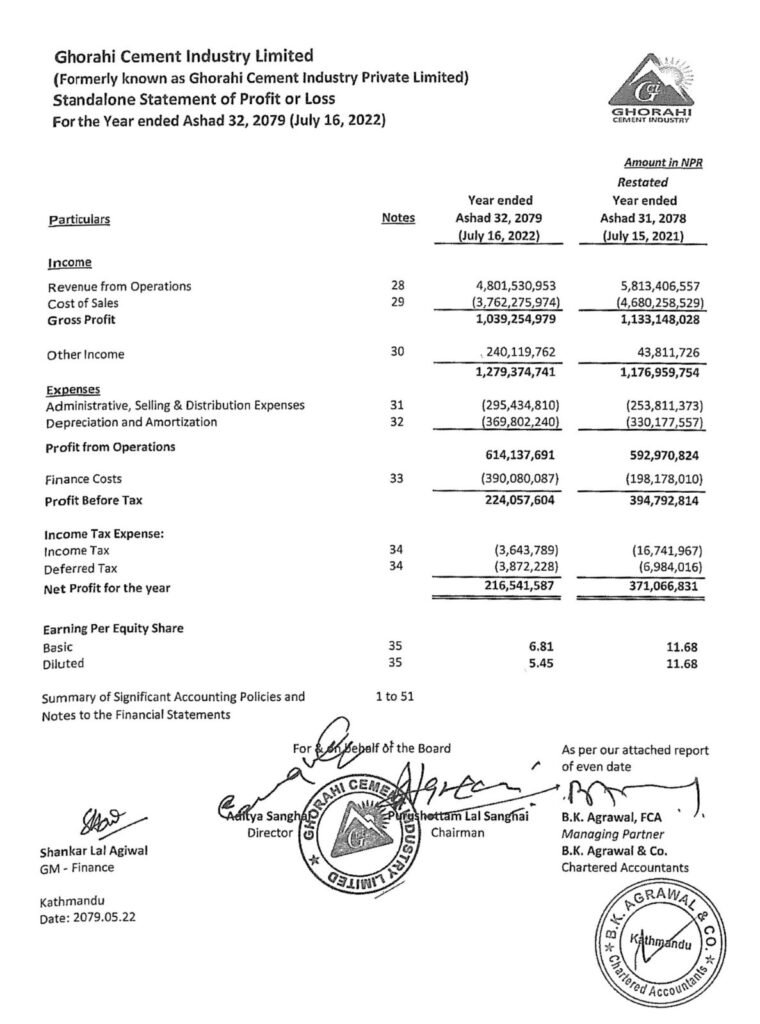
Source Ghorahi Cement. (n.d.). Financial report: FY 78-79. Retrieved September 10, 2024, from https://ghorahicement.com.np/assets/financial-report/FY%2078-79.pdf
माथिको financial statement Ghorahi Cement Limited को financial year 78-79 ending असार 2079 को हो जसमा following कुराहरु देख्न सकिन्छ।
- Total Assets (2079): NPR 21,655,661,019
- Total Equity (2079): NPR 7,200,441,020
- Total Liabilities (2079): 21,655,661,019−7,200,441,020=14,455,219,999
- Interest Expense (Finance Costs): NPR 390,080,087
- Gross Profit: NPR 1,039,254,979
- Net Profit: NPR 216,541,587
- EBIT (Operating Profit): NPR 614,137,691
- Revenue: NPR 4,801,530,953
Let’s do some calculation
1. Gross Profit Margin:
Gross Profit Margin=Gross Profit/Revenue ×100
Gross Profit Margin=1,039,254,979/4,801,530,953×100=21.64%
Company ले 21.64% gross profit earn गरिरहेको छ आफ्नो sales बाट, जसले यसको production को direct costs handle गर्न कति efficient छ भन्ने indicate गर्छ। Higher gross profit margins ले suggest गर्छ कि raw materials र manufacturing costs मा राम्रो control छ।
2. Operating Profit Margin
Operating Profit Margin = Operating Profit/Revenue from Operations×100
Operating Profit Margin = 614,137,691/4,801,530,953×100=12.79%
Operating profit margin 12.79% छ, जसले बुझाउँछ कि company ले operational activities बाट Rs. 100 को revenue मा Rs. 12.79 earn गरेको छ, operating expenses (जस्तै salaries, rent, र अरु costs) subtract गरेपछि। यो ratio ले company को main business operations कति राम्रोसँग manage भएको छ भन्ने देखाउँछ।
3. Net Profit Margin:
Net Profit Margin=Net Profit/Revenue from Operations×100
Net Profit Margin=216,541,587/4,801,530,953×100=4.51%
4.51% net profit margin means, प्रत्येक Rs. 100 revenue मा, company ले सबै expenses पछि Rs. 4.51 profit कमाइरहेको छ। Positive छ, but यो बुझिन्छ कि revenue को significant part finance costs, administrative expenses, र taxes जस्ता indirect expenses ले consume गरेको छ।
4. Return on Equity (ROE):
ROE=Net Profit/Total Equity×100
ROE=216,541,587/7,200,441,020×100=3.01%
3.01% return on equity (ROE) indicate गर्छ कि company ले आफ्नो shareholders को invested equity बाट 3.01% return generate गरेको छ। यो relatively low छ, जसले suggest गर्छ कि shareholders ले industry मा अरु companies सँग तुलना गर्दा significant return पाएका छैनन्।
5. Return on Assets (ROA)
ROA = Net Profit/Total Assets×100
ROA = 216,541,587/21,655,661,019×100=1%
ROA 1% मात्र छ, जसले बुझाउँछ कि company ले आफ्नो total assets ले Rs. 100 को लगानीमा Rs. 1 को profit earn गरेको छ। यो ratio ले company को assets utilize गरेर कति profit generate भयो भन्ने indicate गर्न मद्दत गर्छ। 1% को ROA धेरै low छ, जसको मतलब company ले assets fully utilize गर्न सकेको छैन।
6. Return on Invested Capital (ROIC)
ROIC = Net Operating Profit After Tax (NOPAT)/Invested Capital×100
NOPAT = Operating Profit minus Tax.
Tax expense = 3,643,789
NOPAT = 614,137,691−3,643,789=610,493,902
Invested Capital = Total Equity + Non-Current Liabilities 7,200,441,020+7,548,181,507=14,748,622,527
ROIC = 610,493,902/14,748,622,527×100=4.14%
ROIC 4.14% छ, जसले बुझाउँछ कि company ले आफ्नो invested capital (equity र long-term liabilities) ले Rs. 100 को लगानीमा Rs. 4.14 को profit generate गरिरहेको छ। यो ratio ले company ले आफ्नो long-term investors लाई कस्तो return दिइरहेको छ भन्ने देखाउँछ। 4.14% को ROIC moderate छ, तर अरु industry standards सँग compare गर्दा better understanding मिल्छ।
• Gross Profit Margin: 21.64% ले राम्रो production cost control देखाउँछ।
• Operating Profit Margin 12.79% छ, जसले राम्रो operational efficiency देखाउँछ।
• Net Profit Margin: 4.51% ले moderate profitability देखाउँछ सबै खर्चहरु कटाएर।
• Return on Equity: 3.01% ले shareholders का लागि कम return देखाउँछ, सायद high finance costs या अरु operating expenses को कारण।
• ROA 1% छ, जसले inefficient use of assets को संकेत गर्छ।
• ROIC 4.14% छ, जसले long-term investments मा moderate returns देखाउँछ, तर अझै सुधारको ठाउँ छ।
Note: यो केवल एउटा उदाहरण मात्र हो र यो financial statement मा 2079 year को मात्र data छ। त्यसैले यसका आधारमा company को evaluation नगर्नु होला।
Conclusion
Profitability ratios भनेको crucial financial measurement हुन्, जसले company ले revenue, assets, या equity बाट कत्तिको earnings generate गर्छ भनेर measure गर्छ। यी ratios ले company को financial health र operational efficiency को insights दिन्छ, जसले गर्दा investors र analysts ले informed decisions लिन सक्छन्। Profitability ratios लाई industry peers वा past performance सँग तुलना गरेर, company ले आफ्नो strengths र weaknesses assess गर्न सक्छ। Higher profitability ratios ले strong financial performance, cost control, र shareholders को लागि value create गर्न सक्ने क्षमता देखाउँछ। Key ratios जस्तै gross margin, operating margin, ROA, ROE, र ROIC ले revenue लाई profit मा बदल्ने efficiency र shareholder returns maximize गर्ने क्षमता measure गर्न मद्दत गर्छ। यसैले, profitability ratios भनेको एक essential tool हो, जसले company ले आफ्नो resources कत्तिको राम्रोसँग manage गरिरहेको छ र कत्तिको efficiently profit generate गरिरहेको छ भनेर बुझ्न सहयोग गर्छ।


